

Scrambling Climate Change Categories: Understanding the Public Health and Sustainability Co-Benefits of Crossing Adaptation and Mitigation Boundaries (part 3 of 3)
The third in a three-part series of blog posts, this post illustrates a web of interconnections between the climate change adaptation and mitigation policies and activities outlined in parts 1 and 2.
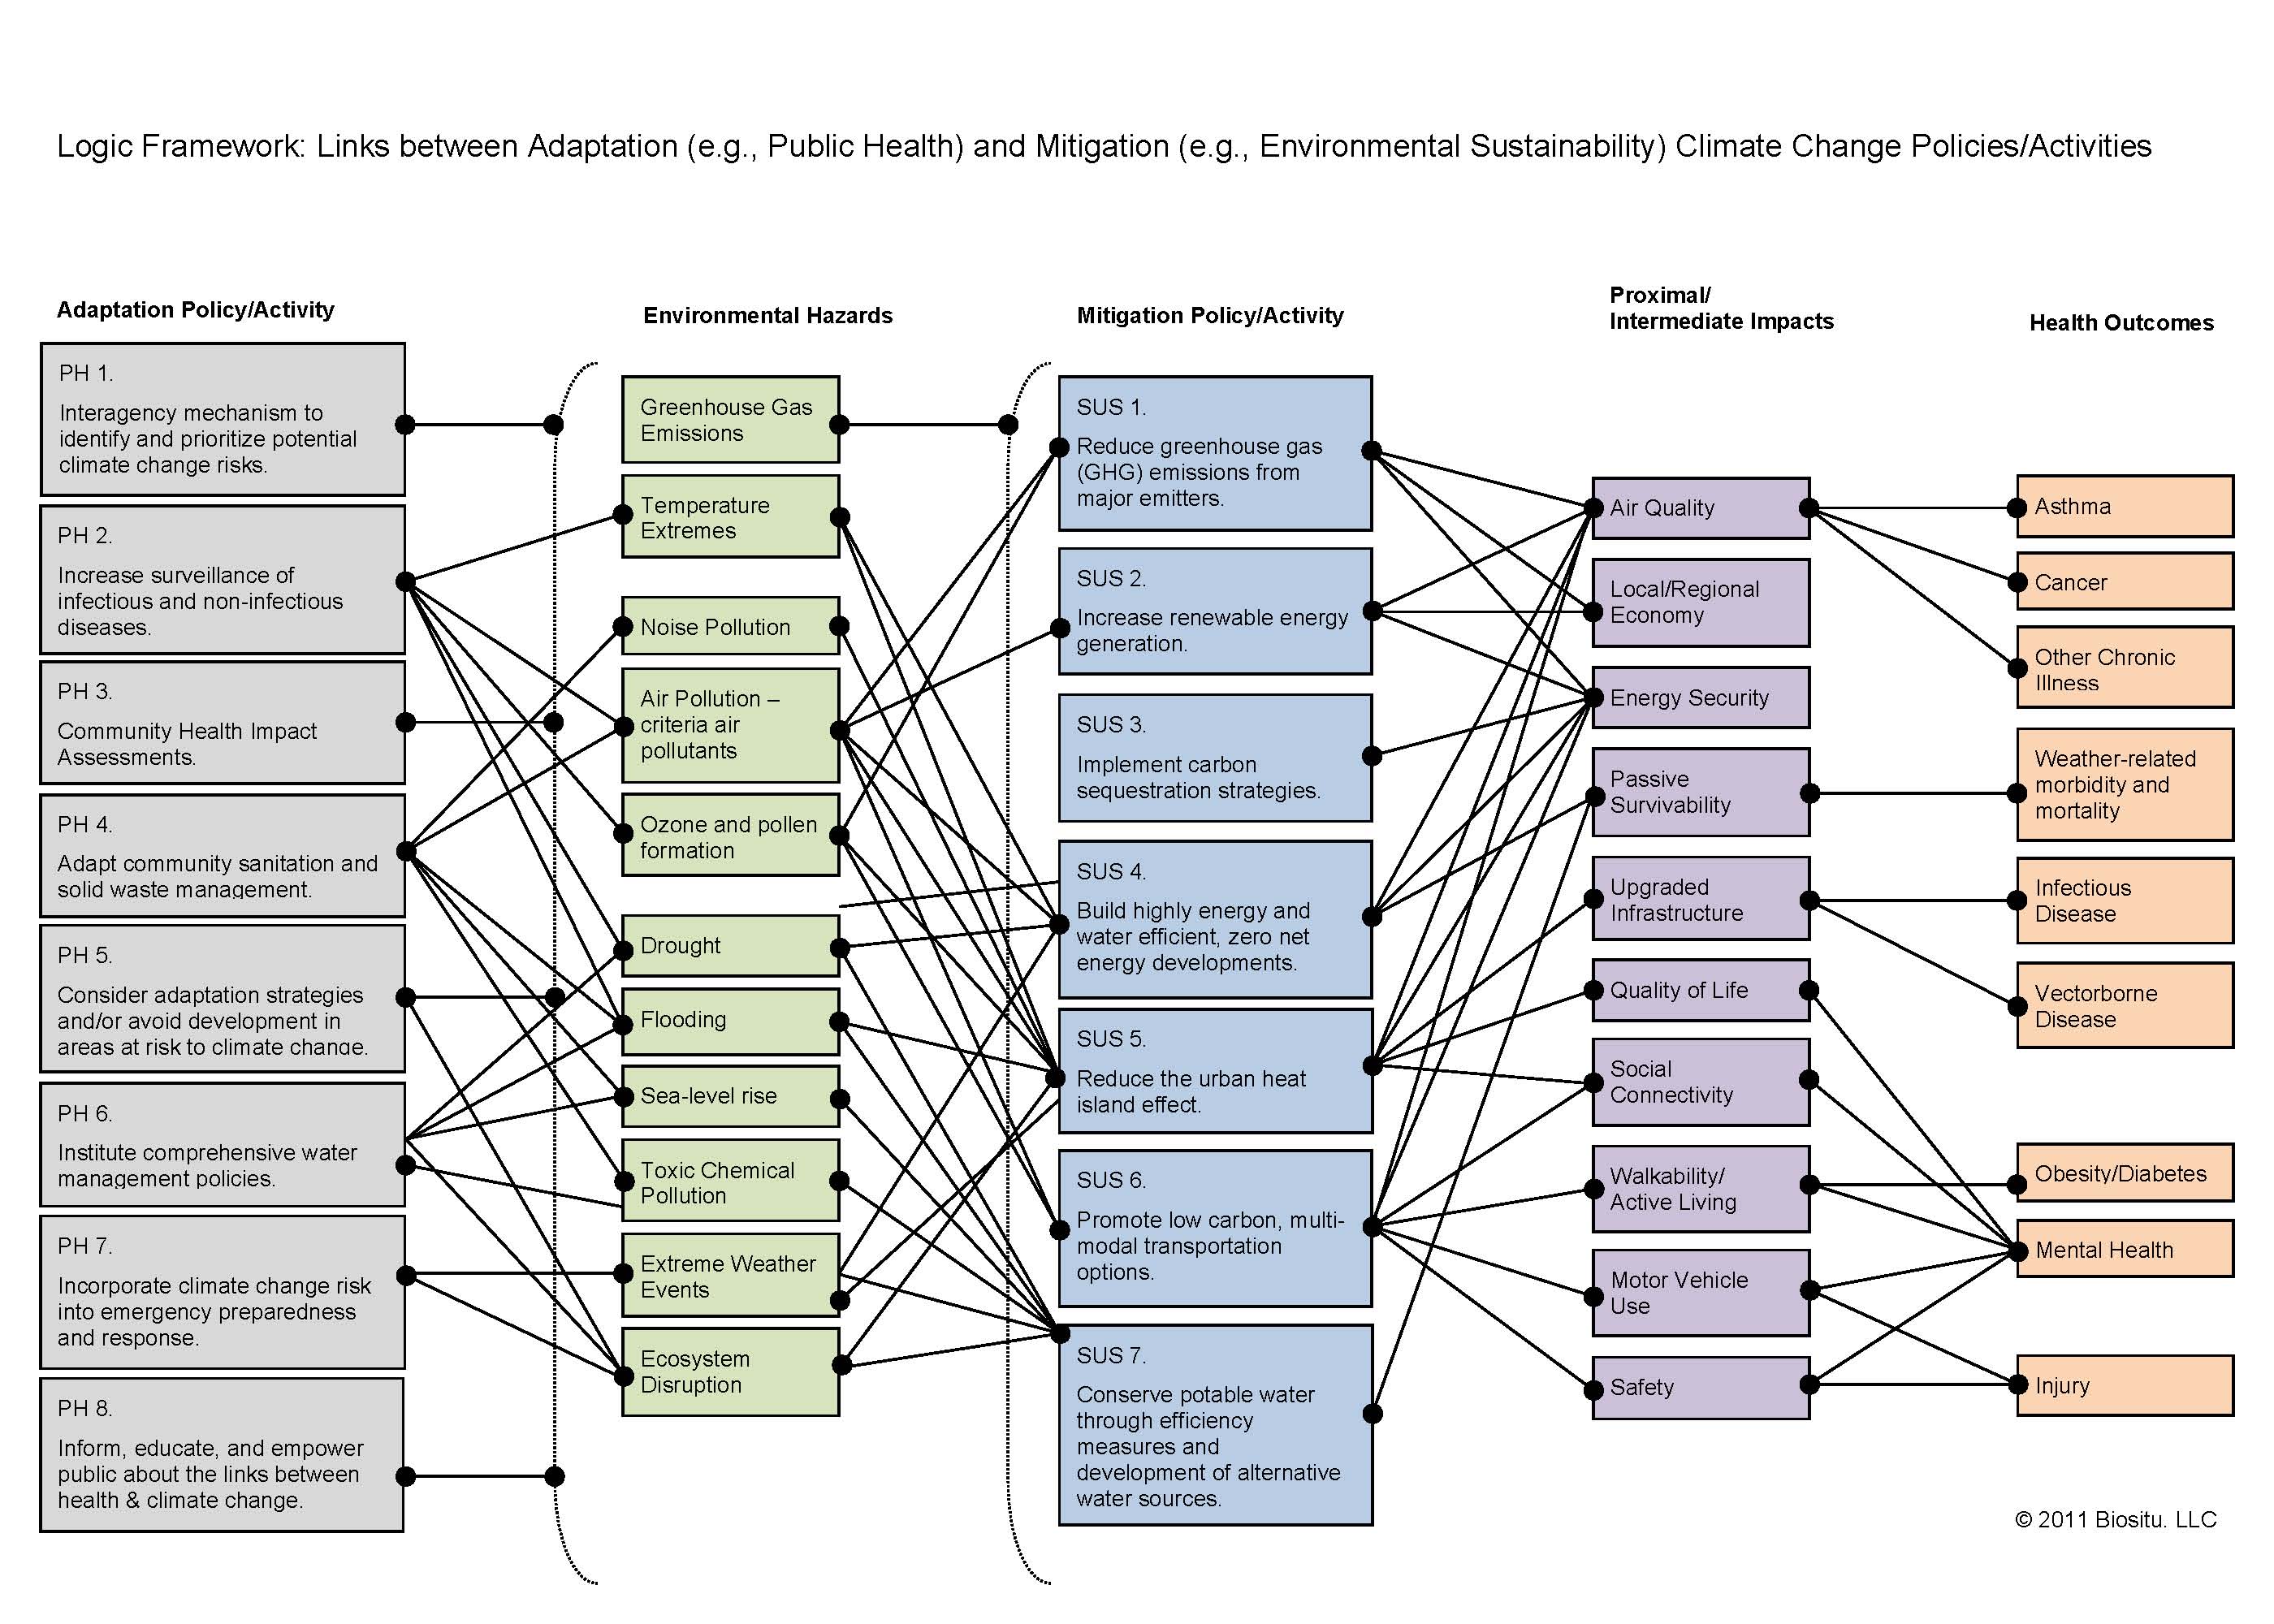
The logic framework below highlights potential environmental and health co-benefits by tracing links between the following categories:
-
Adaptation policies/activities
-
Environmental hazards
-
Mitigation policies/activities
-
Proximal/Intermediate Impacts
-
Health outcomes
Diagrams such as this one can be used to identify relevant causal pathways between public health, environmental, economic, and climate change priorities. By mapping out how a single metric such as concentrations of criteria air pollutants can act as an indicator for multiple policies, this approach can support integration of two policy initiatives (adaptation and mitigation) that have too often been separated.
Copyright: © Biositu, LLC, and Building Public Health, 2010.
Scrambling Climate Change Categories: Understanding the Public Health and Sustainability Co-Benefits of Crossing Adaptation and Mitigation Boundaries (part 2 of 3)
The second in a three-part series of blog posts, this post reviews the traditional role of sustainability in climate change activities. Part 3 will connect the dots between the adaptation and mitigation strategies outlined in parts 1 and 2.
The following mitigation activities fall within the traditional role of environmental sustainability:
1. Reduce greenhouse gas (GHG) emissions from major emitters such as power plants, landfills, refineries, cement production facilities, buildings, and transportation.
Link to Environmental Sustainability
The most direct way to slow global warming will be to reduce the amount of GHG emitted to the atmosphere by human activities. According to the Intergovernmental Panel on Climate Change Fourth Assessment Report released in 2007, the rising average temperatures associated with climate change have already affected the environment, compromising biodiversity and threatening natural resources such as access to fresh water.
Sample Locations
National
U.S. EPA: On September 30, 2009, the U.S. EPA proposed instituting mandatory federal emission limits for the largest emitters: facilities emitting >25,000 tons of GHG annually. The EPA estimates that this program will address 70% of national GHG emissions from stationary sources. (link)
U.S. Mayors Climate Protection Agreement: Item 1, “Inventory global warming emissions in City operations and in the community, set reduction targets and create an action plan.” (link)
California
California Assembly Bill 32 (CA AB32) Global Warming Solutions Act of 2006: Targets reducing statewide GHG emissions to 1990 levels by 2020. (link)
Targeted sectors include:
-
Agriculture: targeted sources of GHG emissions include manure, fertilizer, offroad equipment
-
High Global Warming Potential (GWP): targets sources emitting GHGs with higher climate impact than CO2. For example, consumer products, fire protection systems, insulating foams, and a variety of refrigerants (mobile air conditioning, residential refrigeration, stationary refrigerants, etc.)
-
Industry and Manufacturing: Energy efficiency and GHG emissions audit for facilities emitting >0.5 million metric tons of carbon dioxide equivalent (MMTCO2E) annually.The currently targeted industries are semiconductors, cement, and glass manufacturing.
-
Oil & Gas Refining: activities include establishing a low carbon fuel standard, surveying oil and natural gas emissions from 2007 to develop an inventory baseline for the industry, and identifying mitigation strategies for natural gas transmission/distribution and refineries.
-
Waste Management/Recycling: targets areas such as commercial recycling, reducing organics in the waste stream, methane emissions from landfills, and anaerobic digestion.
California Cap-and-Trade Program: This program was created to speed compliance with CA AB32. AB32 requires that it launch by January 2011. It is being developed in coordination with the Western Climate Initiative with the goal of contributing to a regional cap-and-trade program. (link)
The November 2009 Preliminary Draft Regulation proposes covering the following sectors:
By 2012: electricity generation (including imports) and industrial sources/processes ≥ 25,000 metric tons of CO2 equivalents (MTCO2e)
By 2015: industrial fuel combustion at facilities with emissions < 25,000 MTCO2e and transportation fuels
Chicago
Chicago Climate Action Plan: Meet the Kyoto Protocol targets by reducing GHG emissions to 80% below 1990 levels by 2050. The plan targets five strategies: energy efficient buildings, clean and renewable energy sources, improved transportation options, reduced waste and industrial pollution, and adaptation. (link)
New Hampshire
Climate Action Plan 2009: Meet the Kyoto Protocol targets by reducing GHG emissions to 80% below 1990 levels by 2050. The plan targets the following sectors: buildings, renewable energy generation, transportation, and carbon sequestration through protection of natural resources. (link)
New York City
plaNYC 2007: Reduce GHG emissions by > 30% by 2030 by avoiding sprawl, investing in clean power, reducing building energy consumption, and enhancing sustainable transportation options. (link)
Seattle
Seattle Action Plan 2006: Targets citywide compliance with the Kyoto Protocol target – a 7% reduction in GHG emissions over 1990 levels by 2012 and an 80% reduction by 2050. If Seattle maintains its 2008 levels, it will meet the 2012 goal. Over 60% of Seattle’s GHG emissions can be linked to transportation emissions, leading it to focus on increasing vehicle efficiency and expanding transportation options. (link)
2. Increase renewable energy generation.
Link to Environmental Sustainability
Renewable energy reduces the need to rely on fossil fuels for energy production, avoiding the release of GHG emissions such as CO2, CH4 (methane), and N2O (nitrous oxide). For additional information, see the U.S. EPA Inventory of U.S. Greenhouse Gas Emissions and Sinks and Union of Concerned Scientists.
Sample Locations
National
U.S. Mayors Climate Protection Agreement: Item 3, “Increase the use of clean, alternative energy.” (link)
California
California Assembly Bill 32 (CA AB32) Global Warming Solutions Act of 2006: Targets reducing statewide GHG emissions to 1990 levels by 2020. (link)
Targeted sectors include:
-
Renewable Portfolio Standard: California electric corporations must meet a 20% renewable energy procurement requirement by 2010.
Chicago
Chicago Climate Action Plan, Renewable Energy Sources mitigation strategy: Targets using renewable energy procurement to reduce total electricity emissions by 20%, increasing distributed generation and combined heat and power to increase the efficiency of electricity generation, and doubling residential renewable energy generation. (link)
New Hampshire
Renewable Energy Act 2007: Requires electricity suppliers in New Hampshire to procure ≥ 25% of total electricity from renewable sources by 2025. (link)
Participation in the Regional Greenhouse Gas Initiative (RGGI), which has capped GHG emissions and will reduce total emissions from the power sector by 10% by 2018. (link)
New York City
plaNYC 2007: Promotion of renewable power sources is one of the City’s strategies to meet its goal of reducing global warming emissions by > 30% by 2030. (link)
Seattle
Seattle Action Plan 2006: 90% of Seattle’s electricity is generated by carbon-neutral hydroelectric dams. GHG emissions from the remaining 10% are offset through the purchase of carbon-offset certificates. The Action Plan targets maintaining electricity production at the municipally-owned Seattle City Lights at zero net GHG emissions. Increased load will be accommodated through conservation and renewable energy sources. Any additional emissions will be offset by purchasing carbon offset certificates. (link)
3. Implement carbon sequestration strategies, such as: afforestation/reforestation and conservation agricultural practices.
Link to Environmental Sustainability
Vegetation consumes CO2 through photosenthesis. It is therefore a possible mitigation strategy – a way to offset some of the GHGs emitted to the atmosphere each year. Natural vegetation also enhances environmental sustainability by promoting biodiversity, reducing erosion and stormwater contamination, and lowering surrounding temperatures through evapotranspiration. For additional information about carbon sequestration, visit the U.S. EPA website.
Sample Locations
National
U.S. Mayors Climate Protection Agreement: Item 11, “Maintain healthy urban forests; promote tree planting to increase shading and to absorb CO2.” (link)
California
California Assembly Bill 32 (CA AB32) Global Warming Solutions Act of 2006: Targets reducing statewide GHG emissions to 1990 levels by 2020. (link)
Current activities in the Forestry sector include:
-
Developing Forest GHG accounting protocols
-
Forest Emissions Inventory.
Chicago
Chicago Climate Action Plan, Energy Efficient Buildings mitigation strategy: Target installation of vegetated/living roofs on 6,000 buildings, and plant one million trees. (link)
New Hampshire
Climate Action Plan 2009: 84% of New Hampshire’s landscape is forested, providing a significant source of potential carbon sequestration capacity. The Action Plan recommends actions that will offer a net GHG emission reduction state-wide, including: investing in forested areas to avoid land conversion (AFW 1.2), protecting agricultural land (AFW 1.1.3), promoting durable wood products (AFW 1.3) and waste reduction (AFW 3.1), and optimizing regional use of biomass for electricity and heating (AFW 2.2). (link)
New York City
MillionTreesNYC: A plaNYC initiative to plant one million new trees in New York City within ten years. The program’s research arm identified calculating the sequestration benefits of the program as a major research goal at its 2009 workshop. (link)
Seattle
Seattle Green Partnership: This public-private venture is committed to restoring 2,500 acres of forested city park lands by 2025, adding 649,000 trees citywide. A 1999 study estimated that Seattle had lost 46% of its heavy tree cover and 67% of its medium tree cover from 1972 to 1996, resulting in a cost of $1.3 million per year in stormwater infrastructure and $226,000 per year in health costs associated with air pollution. Reforestation will potentially benefit the city both by removing CO2 and other pollutants from the air and by providing a source of revenue through the generation of carbon offset credits. Seattle Green Partnership estimates that each acre of conifer forest it restores will provide the City with $195,000 worth of carbon sequestration (at $6 per ton of CO2e). (link)
4. Build highly energy and water efficient, zero net energy developments.
Link to Environmental Sustainability
According to the U.S. EPA, the building sector (industrial, commercial, and residential) accounted for 19.5% of total U.S. GHG emissions in 2007. Developments that produce enough renewable energy on-site to contribute to the overall grid’s power supply an equal or greater amount of electricity as their demand are called “zero net energy.” This strategy takes advantage of energy and water efficient building design, multi-modal transportation planning, on-site renewable energy sources, and smart grid technology to reduce the electrical load on fossil fuel sources of power generation.
Sample Locations
National
U.S. Mayors Climate Protection Agreement: Item 2, “Adopt and enforce land-use policies that reduce sprawl, preserve open space, and create compact, walkable urban communities.” (link)
Austin
Austin Climate Protection Plan 2007: Upgrade building code to require: all new single-family homes to be constructed zero-net energy capable by 2015; 75% increased energy efficiency in all non-residential new construction by 2015; point of sale disclosure of opportunities for energy efficiency retrofits and upgrades. (link)
California
California Assembly Bill 32 (CA AB32) Global Warming Solutions Act of 2006: Targets reducing statewide GHG emissions to 1990 levels by 2020. (link)
Current activities in the Local Initiatives and Land Use sector include:
-
Encouraging local government and regional actions
-
Research into low carbon options for land use development
-
Establishing urban forest GHG reporting protocols.
Chicago
Chicago Climate Action Plan Energy Efficient Buildings mitigation strategies: 70% of Chicago’s GHG emissions can be linked to the building sector. Efficiency mitigation strategies include: 30% energy reduction in both new and existing buildings, water efficiency measures, and promotion of vegetated/living roofs. (link)
New Hampshire
Climate Action Plan 2009: Building heating and electricity use account for over 60% of energy use in New Hampshire. Recommendations targeting low-GHG emitting developments include: maximizing efficiency in new (RCI 1.1) and existing (RCI 1.2) buildings; updating energy codes (RCI 1.4); preserving the existing building stock (RCI 1.8); and, assessing fees, incentives and zoning rules to promote low-GHG developments (TLU 2.C.1, TLU 2.C2). (link)
Seattle
Seattle Action Plan 2006: Buildings and equipment accounted for 21% of Seattle’s GHG emissions in 2008. The majority of building emissions are due to the use of natural gas for heating, appliances, and hot water, because Seattle electricity is delivered to customers at net zero emissions. Building and transportation codes have been targeted to increase density and encourage energy and water efficiency while also supporting access to multiple modes of transportation. (link)
Action #1: Significantly Increase the Supply of Frequent, Reliable and Convenient Public Transportation
Action #2: Significantly Expand Bicycling and Pedestrian Infrastructure
Action #5: Expand Efforts to Create Compact, Green Urban Neighborhoods
Action #10: Substantially Increase Natural Gas Conservation
Action #11: Strengthen the State Residential Energy Code
5. Reduce the urban heat island effect.
Link to Environmental Sustainability
The urban heat island (UHI) effect refers to the tendency for urban areas with large swathes of impermeable surfaces to experience higher temperatures than rural areas. The higher temperatures can lead to more intensive use of air conditioning during the summer, intensified air pollution and GHG emissions, and impaired water quality. For more information about UHI, visit the U.S. EPA website.
Sample Locations
National
U.S. Mayors Climate Protection Agreement: Item 11, “Maintain healthy urban forests; promote tree planting to increase shading and to absorb CO2.” (link)
Austin
Austin NeighborWoods Program offers free tree planting along rights of way to build a tree canopy shading Austin’s streets. Over 4,000 trees are planted each year through the program. (link)
Austin Parks and Recreation Department Urban Forestry Program: Targets planting ≥ 1,000 trees per year. (link)
Chicago
Chicago Climate Action Plan, Energy Efficient Buildings mitigation strategy: Target installation of vegetated/living roofs on 6,000 buildings, and plant one million trees. (link)
New York City
New York City Regional Heat Island Initiative: A study sponsored by the New York State Energy and Research Authority (NYSERDA) calculated the relative effectiveness of existing UHI mitigation strategies in New York City. All of the following strategies were found to reduce ambient temperature, however the most effective strategy would combine tree planting along streets and in open spaces with installing vegetated/living roofs throughout the city. (link)
-
Urban forestry
-
Light surfaces (roofs, sidewalks, streets)
-
Vegetated/Living roofs
6. Promote low carbon, multi-modal transportation options.
Link to Environmental Sustainability
According to the U.S. EPA, the transportation sector accounted for 26.3% of total U.S. GHG emissions in 2007. Transportation infrastructure such as roads and railways can fragment wildlife habitats. Oil and other vehicle pollutants deposited on roadways are washed into the storm sewer and surrounding vegetation during rain events, compromising water quality. Road design is also often a determining factor in the success of sustainable developments. Pedestrian-friendly street widths and block sizes, in addition to the availability of contiguous sidewalks and multiple forms of alternative transportation can help raise the occupant density necessary to support the economic success of mixed-use, sustainable developments.
Sample Locations
National
U.S. Mayors Climate Protection Agreement: Item 3, “Promote transportation options such as bicycle trails, commute trip reduction programs, incentives for car pooling and public transit.” (link)
California
California Assembly Bill 32 (CA AB32) Global Warming Solutions Act of 2006: targets reducing statewide GHG emissions to 1990 levels by 2020. (link)
The Transportation sector targets transportation of both people and goods, such as:
-
Passenger vehicles: Increased fuel efficiency, Reflective glazing, Tire pressure, Feebates, Zero Emission Vehicles
-
Heavy-duty vehicles: Increased fuel efficiency, Hybrid requirements, Anti-Idling
-
Ports: Shore power for ocean-going vessels, Vessel speed, Cargo handling equipment
Chicago
Chicago Climate Action Plan, Transportation mitigation strategies (link):
-
Increase transportation options: 30% increase in public transit ridership, expand transit incentive programs, target one million walking and cycling trips per year, increase car share/carpool ridership, support the development of high-speed intercity passenger rail.
-
Efficiency and alternative fuels: Improve the efficiency of City of Chicago fleet vehicles, increase the use of alternative fuel sources, and advocate for higher federal fuel efficiency standards.
-
Other: Promote transit-oriented development and more efficient freight movement.
New Hampshire
Climate Action Plan 2009: Due to its largely rural character, the actions targeting reduction in vehicle-miles traveled in the New Hampshire Climate Action Plan focus primarily on improving and expanding local and intra-regional bus and rail service as well as the Park-and-Ride infrastructure. Other actions include expanding the state’s walking and cycling infrastructure. (link)
New York City
plaNYC 2007: Improve travel times and bring the entire transportation system into a state of good repair using the following strategies: expand the transit infrastructure, improve service on the existing infrastructure, promote additional modes of transportation such as cycling and ferries, and reduce congestion. (link)
Seattle
Seattle Action Plan 2006: Over 60% of Seattle’s GHG emissions can be linked to transportation emissions, leading it to focus on increasing vehicle efficiency and expanding transportation options for close to one half of its targeted actions. (link)
Action #1: Significantly Increase the Supply of Frequent, Reliable and Convenient Public Transportation
Action #2: Significantly Expand Bicycling and Pedestrian Infrastructure
Action #3: Lead a Regional Partnership to Develop and Implement a Road Pricing System
Action #4: Implement a New Commercial Parking Tax
Action #5: Expand Efforts to Create Compact, Green Urban Neighborhoods
Action #6: Improve the Average Fuel Efficiency of Seattle’s Cars and Trucks
Action #7: Substantially Increase the Use of Biofuels
Action #8: Significantly Reduce Emissions from Diesel Trucks, Trains, and Ships
7. Conserve potable water through efficiency measures and development of alternative water sources.
Link to Environmental Sustainability
Warming temperatures can lead to changes in the number and intensity of rain events; increased drought conditions; increased evaporation rates; and, reductions in fresh water sources such as snow packs, lakes, and rivers. As global warming progresses and the global population increases, water demand is likely to rise, which will impact energy demand because the two are intimately connected. Centralized energy production, particularly biofuel and hydropower, are extremely water intensive. On the flip side, moving water is extremely energy intensive due to its weight. Water and energy are also connected through building systems, where tradeoffs between water efficiency and energy efficiency are regularly incorporated into air conditioning, refrigerators, ice machines, and other mechanical and refrigeration equipment. For additional information, please review the U.S. Global Change Research Program’s 2009 Report “Global Climate Change Impacts in the United States” and the Pacific Institute.
Sample Locations
National
U.S. Mayors Climate Protection Agreement: Item 9, “Evaluate opportunities to increase pump efficiency in water and wastewater systems; recover wastewater treatment methane for energy production.” (link)
Austin
Austin Climate Protection Plan 2007: Targets the co-benefits associated with water conservation, energy conservation, and fossil fuel use reduction through actions such as: reducing peak day water use by 1%, instituting landscape irrigation restrictions between 10am and 7pm, offering rebates for water efficient appliances and rainwater harvesting, expanding the municipally-reclaimed water system, and upgrading water efficiency requirements through the plumbing code. (link)
California
California Assembly Bill 32 (CA AB32): Global Warming Solutions Act of 2006 targets reducing statewide GHG emissions to 1990 levels by 2020. Current activities in the Water sector include: encouraging water recycling and increasing water efficiency both by the end user, in landscape irrigation, and in the municipal water system.
New York City
plaNYC 2007: Protect water quality and ensure adequate supply of potable water using the following strategies: protect water sources through the watershed protection program, reduce citywide water consumption by 60 million gallons/day through efficiency measures, and evaluate new water sources such as reusing municipally treated reclaimed water for greywater purposes (e.g., toilet flushing, irrigation, etc.). (link)
Suggested Additional Reading
Intergovernmental Panel on Climate Change Fourth Assessment Report (link)
Kyoto Protocol (link)
U.S. EPA , 2009 U.S. Greenhouse Gas Inventory Report (link)
U.S. Global Change Research Program, “Global Climate Change Impacts in the United States,” 2009 (link)
U.S. Mayors Climate Protection Agreement (link)
Copyright: © Biositu, LLC, and Building Public Health, 2010.
Scrambling Climate Change Categories: Understanding the Public Health and Sustainability Co-Benefits of Crossing Adaptation and Mitigation Boundaries (part 1 of 3)
Categories fill an important role in the development of new fields of study. They set a framework for understanding new ideas. They inform priorities for research and innovation. And, they encourage engagement with complicated concepts by attaching a “short hand” label to topics that might otherwise only be discussed in academic or scientific circles.
Scientific and political authorities have developed two such categories, or labels, to distinguish between policy responses to climate change.
Adaptation refers to activities that reduce vulnerability to the projected short- and long-term impacts of climate change.
Mitigation refers to activities that reduce greenhouse gas (GHG) emissions, thereby working to slow (and eventually stop) global warming.
Public health and sustainability have traditionally identified with different climate change categories: public health participating in adaptation activities and sustainability focusing on mitigation technologies and strategies.
This series of three blog posts will review the traditional role of public health (part 1) and sustainability (part 2) in climate change activities before proposing that both disciplines would be better served by collaboratively engaging across categories—combining adaptation with mitigation (part 3).
The following adaptation activities fall within the traditional role of Public Health:
1. Establish a formal interagency mechanism to identify and prioritize potential risks to human, natural, and economic systems resulting from climate change. Support vulnerable communities’ adaption to these changes.
Link to Public Health
Certain populations are particularly at risk to the public health consequences of climate change. Public Health can help identify vulnerable populations and target preparedness and emergency response activities to reduce vulnerability and increase resilience.
Sample Locations
Alaska
Health and Culture Adaptation Options, September 2009, HC15: Office of Climate Change Coordination (link)
Arizona
Establish a state adaptation advisory group (link)
California
Climate Adaptation Advisory Panel (link)
California, 2009 Climate Adaptation Strategy, Public health strategy 7 (link)
Florida
Energy and Climate Change Action Plan: Phase 2, 2008, GP-3: Inter-Government Planning Coordination and Assistance and ADP-13: Coordination with Other Regulatory and Standards Entities (link)
Miami-Dade County, Florida
Second Report and Initial Recommendations, 2008, Recommendation C.3, D.10, E.4, F.3, F.4 (link)
2. Increase surveillance of infectious and non-infectious diseases associated with climate change.
Link to Public Health
A public health surveillance infrastructure already exists at the state level and, to some extent, at the local level. The CDC launched a National Environmental Public Health Tracking Network in 2009 to coordinate activities at the state and local level and start building a national surveillance program.
Depending on the location, climate change could be linked to diseases associated with:
-
changes in the season and range of vectors (e.g., mosquitoes);
-
sanitation concerns associated with disrupted services during emergencies;
-
waterborne illness associated with water scarcity, flooding, storm surge, etc.; and,
-
vector, air quality, and water contamination concerns associated with solid waste management.
Sample Locations
Alaska
Health and Culture Adaptation Options, September 2009, HC2: Surveillance and Control (link)
California
2009 Climate Adaptation Strategy, Public health strategy 4 (link)
Miami-Dade County, Florida
Climate Change Advisory Task Force, Second Report and Initial Recommendations, 2008, Recommendation E.2 (link)
3. Community Health Impact Assessments
Link to Public Health
Screen proposed climate change adaptation and mitigation activities for direct and indirect public health benefits and harms. For example, incorporate climate change adaptation screening into Environmental Impact Assessments. Prioritize activities that promote resilience and minimize direct and indirect harm to public health, the environment, and the economy.
Sample Locations
Alaska
Health and Culture Adaptation Options, September 2009, HC3: Community Health Impact Evaluation Initiative (link)
California
2009 Climate Adaptation Strategy, Key recommendation 8 (link)
Florida
Energy and Climate Change Action Plan: Phase 2, 2008, ADP-2: Comprehensive Planning and ADP-11: Organizing State Government for the Long Haul (link)
4. Adapt community sanitation and solid waste management to respond to a changing climate.
Link to Public Health
Sanitation and solid waste systems may be compromised by a warming climate:
-
Melting permafrost in northern regions can lead to subsidence, causing structural rupture of sanitation systems.
-
Storm surges and flooding can compromise water treatment plants and sanitary sewers.
-
Drought can compromise source water quantity and quality.
-
Vectors and pests may extend their range into areas not prepared for them due to warming ambient temperatures
Sample Locations
Alaska
Health and Culture Adaptation Options, September 2009, HC4: Sanitation (link)
Miami-Dade County, Florida
Climate Change Advisory Task Force, Second Report and Initial Recommendations, 2008, Recommendation F.2 (link)
King County, Washington
2008 King County Climate Report: Land Use, Buildings and Transportation Infrastructure (link)
New York City
plaNYC 2007, Climate Change Initiative 1: Create an Intergovernmental Task Force to Protect Our Vital Infrastructure (link)
5. Consider adaptation strategies and/or avoid development in areas at risk to climate-related hazards, such as flooding, wildfires, erosion, subsidence, etc.
Link to Public Health
Developments that are vulnerable to climate change are also vulnerable to accompanying public health risks, such as drowning, heat stroke, waterborne disease, etc. Many public health crises can be avoided by prohibiting development in vulnerable areas and by incorporating community resilience into planning requirements.
Sample Locations
California
2009 Climate Adaptation Strategy, Key recommendations 3 & 5 (link)
Miami-Dade County, Florida
Climate Change Advisory Task Force, Second Report and Initial Recommendations, 2008, Recommendation C.1, D.4, E.1 (link)
New York City
plaNYC 2007, Energy Initiative 3: Strengthen energy and building codes for New York City (link)
6. Institute comprehensive water management policies.
Link to Public Health
Water quality can be protected through efficiency measures, protecting water sources, and supporting ecosystem resilience in the areas that supply water.
Water supplies may need to be drawn from new sources to meet demand, such as rainwater, on-site wastewater treatment, and municipally reclaimed water. Public health considerations should be incorporated into the regulations governing these new technologies to protect the public from exposure to waterborne diseases.
Sample Locations
California
2009 Climate Adaptation Strategy, Key recommendation 2 (link)
Colorado
Climate Action Panel, 2007 Report, WA 1-WA 14 (link)
Florida
Energy and Climate Change Action Plan: Phase 2, 2008, ADP-4: Water Resources Management (link)
Miami-Dade County, Florida
Climate Change Advisory Task Force, Second Report and Initial Recommendations, 2008, Recommendation D.4, D.5, D.7 (link)
King County, Washington
2008 King County Climate Report: Surface Water Management, Freshwater Quality and Water Supply (link)
7. Incorporate climate change risk into emergency preparedness, hazard mitigation, and response plans.
Link to Public Health
Incorporating public health surveillance data into regional climate change models will help emergency responders prepare for short- and long-term shifts in the type and intensity of climate-related events.
Sample Locations
California
2009 Climate Adaptation Strategy, Key recommendation 10, Comprehensive state strategy 3, Public health strategy 5 (link)
Florida
Energy and Climate Change Action Plan: Phase 2, 2008, ADP-8: Emergency Preparedness and Response (link)
King County, Washington
2008 King County Climate Report: Flood control (link)
New York City
plaNYC 2007, Initiative 3: Launch a Citywide Strategic Planning Process for Climate Change Adaptation (link)
8. Inform, educate, and empower the public about the links between health and climate change.
Link to Public Health
Community engagement is one of the 10 essential services of public health. Many of the topics that form part of traditional public health educational outreach are also connected with climate change: extreme heat, winter weather, flooding, air quality (asthma, allergies, etc.), exposure to toxic chemicals, etc. A climate change public education and engagement program should build off of these longstanding public health concerns to establish links between individual behavioral changes and climate change mitigation and adaptation.
Sample Locations
California
2009 Climate Adaptation Strategy, Public health strategy 2 (link)
Florida
Energy and Climate Change Action Plan: Phase 2, 2008, ADP-14: Education (link)
Miami-Dade County, Florida
Climate Change Advisory Task Force, Second Report and Initial Recommendations, 2008, Recommendation E.3, F.1, F.5, F.6 (link)
New York City
plaNYC 2007, Climate Change Initiative 2: Work with Vulnerable Neighborhoods to Develop Site-Specific Strategies (link)
The next installment of this post will review mitigation activities that fall within the traditional role of sustainability.
Suggested Additional Reading
Center for Climate Strategies, http://www.climatestrategies.us/
King County, Washington
Preparing for Climate Change: A Guidebook for Local, Regional, and State Governments, 2007, http://cses.washington.edu/cig/fpt/guidebook.shtml
Intergovernmental Panel on Climate Change, http://www.ipcc.ch/
Climate Change 2007: Synthesis Report, http://www.ipcc.ch/pdf/assessment-report/ar4/syr/ar4_syr.pdf
Pew Center on Global Climate Change, http://www.pewclimate.org
Adaptation, http://www.pewclimate.org/hottopics/adaptation
Energy Efficiency , http://www.pewclimate.org/energy-efficiency
Copyright: © Biositu, LLC, and Building Public Health, 2010.
Background Reading on Climate Change and Public Health
This post outlines suggested reading on public health issues associated with climate change. I will update it as new reports and studies are released.
The CDC Climate Change website suggests the following papers as a broad foundation on the health effects of climate change:
Frumkin H, Hess J, and Vindigni S. Peak petroleum and public health. JAMA. 298:1688-1690, 2007.
Frumkin H, Hess J, Luber G, Malilay J, and McGeehin M. Climate Change: The Public Health Response. Am J Public Health. 98:435-445, 2008.
Luber G, and Hess J. Climate change and human health in the United States. J of Env Health. 70(5):43-44, 2007.
Patz JA, McGeehin M, Bernard SM, Ebie KL, Epstein PR, Grambsch A, Gubler DJ, Reiter P, Romieu I, Rose JB, Samet JM, Trtang J. The potential health impacts of climate variability and change for the US. Env Hlth Pers. 108 (4): 36-54, 2000.
CDC is also launching a webinar series titled “Climate Change: Mastering the Public Health Role.” For more information, visit the Climate Change and Public Health Workforce Development web page.
Additional general resources:
Climate Change: Our Health in the Balance, American Public Health Association 2008 National Public Health Week Partner Toolkit
The Association of State and Territorial Health Officials (ASTHO) convened a series of webinars in 2008 and 2009 focused on the public health impacts of climate change: http://www.astho.org/Programs/Environmental-Health/Natural-Environment/Climate-Change-and-Public-Health/
Trust for America’s Health released an issue report in October 2009 highlighting climate change activity to date both at the federal level and by state and local health departments: Health Problems Heat Up: Climate Change and the Public’s Health
The U.S. Climate Change Science Program and the Subcommittee on Global Change Research released the following report on the health effects of global change in 2008: Analyses of the Effects of Global Change on Human Health and Welfare and Human Systems
The World Health Organization has released a training course on climate change and health targeted to public health professionals: Protecting our Health from Climate Change
Copyright: © Biositu, LLC, and Building Public Health, 2010.
Environmental Pioneers: Public Health and Sanitation
Environmental sustainability often appears totally unrelated to the day to day work of a public health official. In many cases, the new technologies touted to reduce energy and water use, encourage composting and recycling, and reduce exposure to potentially harmful emissions in building materials and housekeeping chemicals raise questions. Do they meet regulatory standards for sanitation? Do tests that work on conventional technology apply to these new systems? Do they straddle regulatory jurisdictions?
This column will argue that environmental sustainability lies at the heart of environmental public health. In fact, the tension between the public health benefits of access to clean water and green space and the public health concerns associated with suburban sprawl (e.g., social isolation, obesity, cardiovascular health, respiratory health, stress, etc.) dates back to the formation of the public health industry in the 18th century.
Jeffersonian Grid: Plotting the Frontier
The origins of land planning and urbanization in the U.S. can be traced to the Land Ordinance of 1785, an arbitrary grid composed of “sections,” each measuring one square mile (or 640 acres), which was projected across the entire North American landmass west of the thirteen original colonies. This division of land is also called the “Jeffersonian Grid,” because Thomas Jefferson proposed the idea as a mechanism to preserve the agrarian lifestyle of the ex-colonies while providing adequate land to all voting citizens. Each citizen was to receive one section of land (640 acres), an acreage calculated by Jefferson as ample to provide for a farming family. 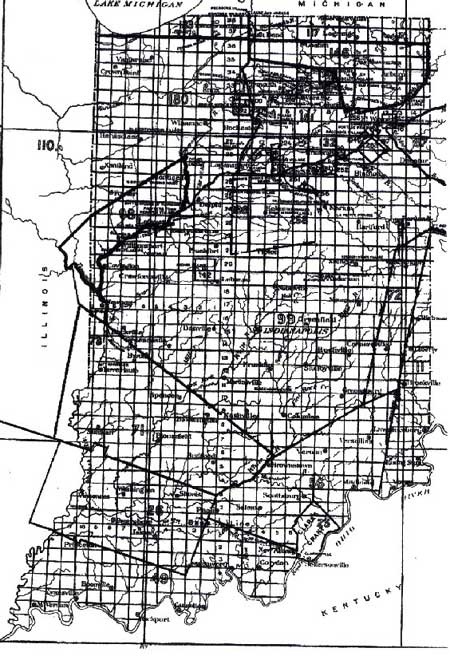
Figure 1: Indiana Land Survey (source: Carl Leiter)
The Jeffersonian grid encouraged Western expansion by subdividing a largely uncharted wilderness into legally defined parcels of land with potential future value. The government opened the majority of vacant land up for sale while retaining the future value of specific sections in each township to support government services such as free public education. [1] The unique relationship between government and landowners in the U.S. can largely be traced to this initial attempt to raise public funds.
The Origins of Public Health Policy: 18th and 19th Century London
In 1785, the same year as the passage of the U.S. Land Ordinance, a movement was gaining momentum in Great Britain that set the foundation for modern public health policies by using the new science of epidemiology to establish a correlation between disease and mortality rates and rapid urbanization. Oddly enough, engineers and urban planners, not doctors, were given the responsibility to improve public health statistics (such as the mortality rate) in urban areas.
The speed of urbanization in this period outstripped the construction industry’s ability to provide proper housing conditions, particularly in London. Urbanization progressed so rapidly that the demographics of the country reversed within a century. In 1801, only 30% of the population of England and Wales lived in urban areas with a minimum of 2,500 people. By 1901, that number had reversed; 70% of the population lived in urban areas. A similar, although not as dramatic, demographic shift occurred in the U.S. during the same period. [2]
Utilitarianism [3], a philosophical movement derived from the Enlightenment, gained popularity in the U.K. in the late 18th and early 19th centuries as a method for improving the overall productivity of the poorer urban populations that were most affected by rapid urbanization. The Utilitarian project conformed to the miasmic theory (the belief that disease was caused by “miasma,” or a poisonous vapor) that disease could be eradicated from urban slums by removing its supposed cause: poor public hygiene and overcrowded housing.
By employing engineers and urban planners to implement Utilitarian concepts, the first public health policies in the U.K. established a distinction between public and private health. Public health was designated as the realm of preventative measures (the engineer’s expertise) and placed in a separate sphere from curative medicine (the doctor’s expertise). Engineers and urban planners spearheaded public health projects such as providing access to clean water, building sanitary sewers, paving roads, and improving access to light in previously overcrowded neighborhoods. Similarly, the first national General Board of Health, established in the U.K. through the Public Health Act of 1848, was dominated by engineers.
Public Health Today
Gradually, through the 19th and 20th centuries, as utility infrastructures improved, the affects of infectious disease outbreaks lessened, and the average American lifespan lengthened, the importance of public health was eclipsed by the medical industry and a growing focus on private health. Today, few doctors are trained to identify and diagnose medical conditions arising out of the patient’s physical surroundings.
And yet, our surroundings largely determine our level of physical activity, our exposure to environmental hazards such as air pollution, and our level of personal interaction. A growing body of research identifies post-war suburban land use in particular as an influential contributor to the chronic diseases that are filling hospital emergency departments and driving up the cost of health insurance. Significantly, many local public health departments interested in engaging in environmental sustainability activities have returned to their roots by offering their expertise to local and regional planning departments that, throughout the 20th century, had focused almost exclusively on the calculated economic and environmental impacts of potential developments and taking their public health consequences for granted.
This column will map out specific examples of linkages between areas of concern within the traditional public health model (i.e., food safety, air quality, solid waste, vector-borne diseases, water and wastewater, etc.) and efforts in environmental sustainability.
The public health industry offers a wealth of science-based experience and expertise waiting to be tapped in the interest of advancing human health, community health, environmental health, and economic health. The case studies, reports, tools, and resources outlined in this column will begin to develop a framework for an enhanced public health identity that includes active engagement and leadership in environmental sustainability.
Copyright: © Biositu, LLC, and Building Public Health, 2010.
[1] “Land Ordinance of 1785,” Wikipedia, http://en.wikipedia.org/wiki/The_Land_Ordinance_of_1785
[2] From 1831 to 1892, the U.S. population changed from one in ten residing in cities to one in four. However, much of population growth during that period of time was due to immigration. From 1850 to 1900, U.S. population grew from 23 million to 76 million inhabitants, most of whom were newly arrived immigrants. Witold Rybczynski, City Life: Urban Expectations in a New World, Scribner: New York, 1995, p. 111, 115.
[3] Information on Utilitarianism and “the sanitary idea” taken from: Graham Mooney, “The Sanitary Idea” lecture, History of Public Health course, Johns Hopkins School of Public Health, http://ocw.jhsph.edu/courses/HistoryPublicHealth/lectureNotes.cfm
A Healthy Climate
With negotiations in Copenhagen only days away, healthcare insurance reform under active discussion, and cap and trade legislation the next big ticket item on the U.S. Congressional agenda, it seems appropriate timing to broaden the climate change debate to include its public health consequences.
Global authorities such as the U.S. Centers for Disease Control and Prevention, the World Health Organization, and the Intergovernmental Panel on Climate Change have identified climate change as a significant emerging threat to public health worldwide.
Why?
Climate scientists have found that Global Warming, the tendency of the Earth to warm when certain gases accumulating in the atmosphere prevent solar radiation from escaping out to space after bouncing off of the Earth’s surface, will cause (and has probably already started causing) increased temperature and increased frequency and severity of extreme weather events such as hurricanes, drought, extreme heat, and flooding.
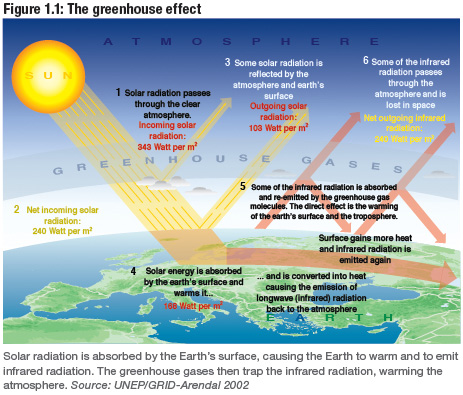
2009 Climate Change Science Compendium. Ed. Catherine P. McMullen. UNEP, September 2009. Figure 1.1. p. 4.
The following table, "Anticipated Health Effects of Climate Change in the United States,” adapted from Frumkin et al., Am J Public Health (2008); 98:435-445, outlines the likely health effects and associated vulnerable populations associated with a changing climate.
|
Weather Event |
Health Effects |
Populations Most Affected |
|
Heat waves |
Heat stress |
Very old Athletes Socially isolated Poor Respiratory disease |
|
Extreme weather events |
Injuries Drowning Mass population movement International conflict Mental health |
Coastal, low-lying land Poor Children Displaced Depression/anxiety General population |
|
Winter weather anomalies |
Slips and falls Motor vehicle crashes |
Northern climate dwellers Elderly Drivers |
|
Sea-level rise |
Injuries Drowning Water and soil salinization Ecosystem disruption Economic disruption |
Coastal dwellers Low SES |
|
Increased ozone and pollen formation |
Respiratory disease exacerbation (e.g. COPD, asthma, allergic rhinitis, bronchitis) |
Elderly Children Respiratory disease |
|
Drought – ecosystem migration |
Food and water shortages Malnutrition |
Low SES Elderly Children |
|
Drought, flooding, increased mean temperature |
Food- and waterborne disease Vector-borne disease |
Swimmers Outdoor workers Outdoor recreation Poor Multiple other populations |
So, why is public health largely excluded from climate change policy?
Climate change policies such as the Kyoto Protocol and non-binding challenges such as U.S. Council of Mayors Climate Protection Agreement have focused largely on encouraging energy efficiency measures and boosting renewable energy capacity for two reasons:
1. They appear to directly address the problem: too many human-generated greenhouse gas emissions; and,
2. They reduce a complex, global crisis into a two, easily digestible strategies.
The problem with this strategy has been that it robs the climate change crisis of immediacy. The average person or company does not “see” the tangible benefits of reducing energy consumption and purchasing renewable energy. Their small contribution will not change the world’s climate in a readily noticeable way, and it probably will not even change the microclimate around an individual house or business unless the activity is coordinated into a neighborhood or district level, as advocated by the Living Building Challenge through the concept of “Scale Jumping.”[1]
Energy efficiency saves money up front to a point, but the cost-benefit analysis for an energy efficiency strategy loses its appeal after the obvious measures have been implemented (e.g., changing to energy efficient light bulbs, etc.) – unless another value proposition is overlaid that brings immediacy and another order of magnitude to the enterprise.
This column will tease out that value proposition by uncovering the links between public health and climate change policies and practices. It will place particular emphasis on economic co-benefits and the power of a health message to build political will and influence behavioral change.
Copyright: © Biositu, LLC, and Building Public Health, 2010.
[1] “Scale Jumping” is defined by the Living Building Challenge as “the implementation of solutions beyond the building scale that maximize ecological benefit while maintaining self-sufficiency at the city block, neighborhood, or community scale.” Source: http://ilbi.org/the-standard/lbc-v1.3.pdf, footnote 14, p. 11.
